
How to detect lines in image using Hough Line Transform (with code example)
Line detection has many applications in image processing and computer vision. A simple example of line detection’s application is SUDOKU Solver. Imagine you want to solve SUDOKU board which locates in an image. First, you have to detect SUDOKU grid and extract digits to recognize those numbers. Hough Line Transform is one of the popular techniques to detect lines in images.
This article will explain how to detect lines in an image using Hough Line Transform with OpenCV library and Python code example.
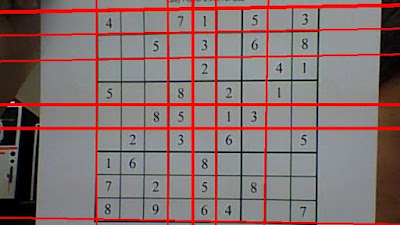
Detecting line on a SUDOKU grid
Note that we can only use Hough Line Transform after detecting edges of the image. In another words, the detected edges image are the input of Hough Line Transform. There are many techniques to detect edges on the image such as Sobel or Canny algorithms. I will explain the idea of these techniques when I have enough time :). But here are very good explanation video of edges detection on Computerphile Channel (Check the link below)
The image after detecting edge will look like the image below. This image is a grayscale image in which every pixel on the edge has the value of 255 or 1 (white). In contrast, those pixels don’t locate on the edge will have a value of 0 (black area).
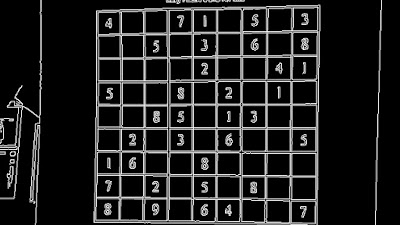
Image after apply edge detection
Now, let’s see how Hough Line Transform can detect lines in the image.
Theory
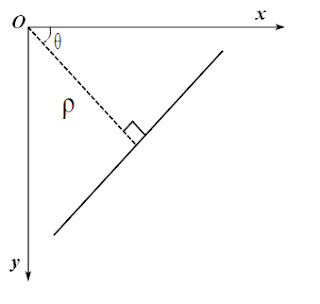
A line can be represented as \(\rho = x\cos \theta + y\sin \theta\) where \(\rho\) is the perpendicular distance from the origin to the line, and \(\theta\) is the angle formed by this perpendicular line and the horizontal axis. That direction varies on how you represent the coordinate system. This representation above is used in OpenCV. Any vertical line will have \(0\) degree and horizontal lines will have 90 degrees of \(\theta\). Normally, the origin point will be the top-left point in the image so the maximum \(\theta\) is \(90\) degrees and minimum \(\theta\) is \(0\) degree.
We know that every point on the line always satisfies this equation: \(\rho = x\cos \theta + y\sin \theta\) (1). If we know a pair of (\(\rho, \theta\)), we always can draw a line.
So, the idea of Hough Transform is creating a 2D array \(M\) as a matrix to hold the values of two parameters (\(\rho\) and \(\theta\)).
Let rows denote the \(\rho\) and columns denote the \(\theta\). We assume there exists a line \(d\) with \(\rho=\rho_1\) and \(\theta=\theta_1\) on the image. If a point \(A(x_1,y_1)\) lies on \(d\) satisfies (1) \(\rho_1=x_1\cos \theta_1+y_1\sin \theta_1\), we increase the value of \(M[\rho_1][\theta_1]\) by \(1\).
We will continue this process for every point on the line, increasing the value of \(M[\rho_1][\theta_1]\) by \(1\) if that point satisfies equation (1). In the end, the value of \(M[\rho_1][\theta_1]\) will be must bigger than another cell in 2D array \(M\). And the value of \(M[\rho_1][\theta_1]\) will be also the length of the line.
The size of the 2D array depends on the accuracy you need. Suppose you want the accuracy of angles to be \(1\) degree, you need \(180\) columns. For \(\rho\), the maximum distance possible is the diagonal length of the image. So taking one pixel accuracy, the number of rows can be the diagonal length of the image.
Example
Suppose we have an image with 20x20 pixels and contain 2 lines (black lines - d1 and d2) like this.
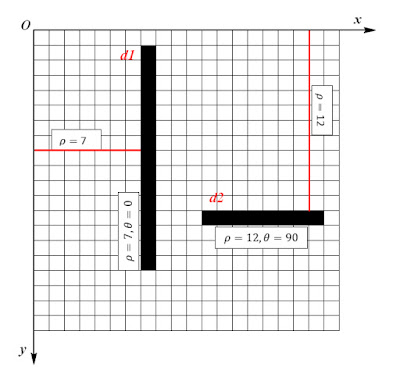
The perpendicular distance between \(d1\) and the origin is \(\rho=7\) and the angle between this perpendicular line and the horizontal axis (\(Ox\)) is \(0\) degrees and the length of \(d1\) is \(15\) (pixels). Similarly with \(d2\), \(\rho=12\), \(\theta=90\), and the length is \(8\) (pixels).
If you want the accuracy of angles to be \(1\) degree and the maximum distance possible is the diagonal length of the image, you will need a 2D array with \(180\) columns and \(28\) rows (\(20\sqrt{2}\approx28\)).
After running Hough Line Transform on that image, we will have \(M[7][0]=15\) and \(M[12][90]=8\) corresponding to the length of \(d1\) and \(d2\).
So now, let’s implement a simple Python code to see how Hough Line Transform actually work.
import numpy as np
from sympy import *

# Create image with 20x20 pixel
img = np.zeros((20,20), dtype=np.int)
# Draw 2 lines correspond with above image
# Every pixel lies on a line will have value of 1
# Draw line d1, length = 15
for i in range(0,15):
    img[i+1][7]=1
# Draw line d2, length = 8
for i in range(11,19):
    img[12][i]=1

# Create a 2D array to holds the value of rho and theta
M = np.zeros((28,91), dtype=np.int)

# Scan image to find some lines
for x in range(20):
    for y in range(20):
        if(img[x][y]==1):
            for rho in range(28):
                for theta in range(0,91):
                    if(rho==y*cos(theta*pi/180) + x*sin(theta*pi/180)
                        M[rho][theta] += 1

# Print the value of M[7][0] and M[12][90] to see the length of d1 and d2
print M[7][0]
# Result: 15
print M[12][90]
# Result: 8
Note that we will use \(\cos\), \(\sin\) method and \(\pi\) in sympy library instead of using numpy because \(\pi\) in numpy (numpy.pi) is not the actual \(\pi\) value. So, you will get the wrong result when using numpy.cos(pi/2).
Try to run by yourself and see how Hough Line Transform works.
Hough Line Transform in OpenCV
In real problem, there are too many lines in image and quite complex to write code and detect line by yourself. I prefer to use OpenCV - A strong Computer Vision library to deal with Line Detection problem.
We can simply use Hough Line Transform in OpenCV with cv2.HoughLines() function. It will return an array of (\(\rho,\theta\)) values. \(\rho\) is measured in pixels and \(\theta\) is measured in radians.
The first parameter of cv2.HoughLines() function is a binary image, so apply thresholding or use canny edge detection before finding applying Hough Line Transform. The second and third parameters are \(\rho\) and \(\theta\) accuracies respectively. The final parameter is the threshold, which means the minimum length of a line to be detected.
Here is the code I took from OpenCV online documents website with adding some explanations.
import cv2
import numpy as np

# Loading image contains lines
img = cv2.imread('lines.jpg')
# Convert to grayscale
gray = cv2.cvtColor(img,cv2.COLOR_BGR2GRAY)
# Apply Canny edge detection, return will be a binary image
edges = cv2.Canny(gray,50,100,apertureSize = 3)
# Apply Hough Line Transform, minimum lenght of line is 200 pixels
lines = cv2.HoughLines(edges,1,np.pi/180,200)
# Print and draw line on the original image
for rho,theta in lines[0]:
 print(rho, theta)
 a = np.cos(theta)
 b = np.sin(theta)
 x0 = a*rho
 y0 = b*rho
 x1 = int(x0 + 1000*(-b))
 y1 = int(y0 + 1000*(a))
 x2 = int(x0 - 1000*(-b))
 y2 = int(y0 - 1000*(a))
 cv2.line(img,(x1,y1),(x2,y2),(0,0,255),2)

# Show the result
cv2.imshow("Line Detection", img)
cv2.waitKey(0)
cv2.destroyAllWindows()
I used this image to run Hough Line Transform:

And here is the result:
References
[1] OpenCV: Hough Line Transform - http://docs.opencv.org/3.1.0/d6/d10/tutorial_py_houghlines.html
[2] Hough Line Transform - Wikipedia - https://en.wikipedia.org/wiki/Hough_transform